Tuesday, January 15, 2013
Bankruptcy is assured. Rhetoric to the contrary.
The ugly reality of Socialism - it always fails.
by StFerdIIIWhen 'experts' who are activists, say that there is GlobaloneyWarming there isn't. When 'experts' say that Apple's stock price will go to $1000 a share, it won't. When 'experts' state confidently, with broad grins that the 'Euro crisis' is over, it means it is just starting. Insolvency relates to matters of economic laws; of income versus expenses; of state obligations and promises juxtaposed against revenue sources and coercive taxation. When the balance of spending and unfunded obligations is so decidedly negative and overwhelms revenue sources even if they were taxed at 100% - the end result is bankruptcy. You can print money, issue press releases, have 'experts' talk up the 'success' of the Euro in the media and it matters not. As with natural physical laws, there exists natural economic laws, which socialization and socialism ignore. This is why communal systems go bankrupt.
The EU is technically bankrupt already. Why will an illogical currency called the Euro, which is really just a devalued DM, survive a fiscal and banking system implosion ? It won't.
Publicly stated EU zone debt levels:
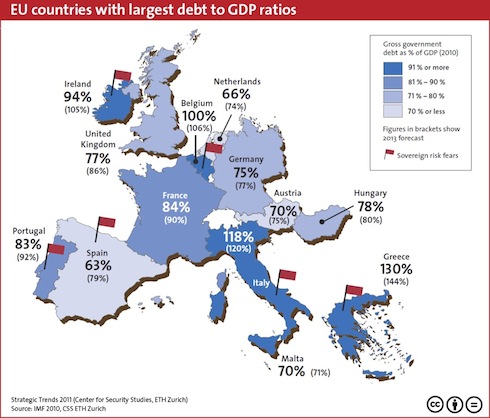
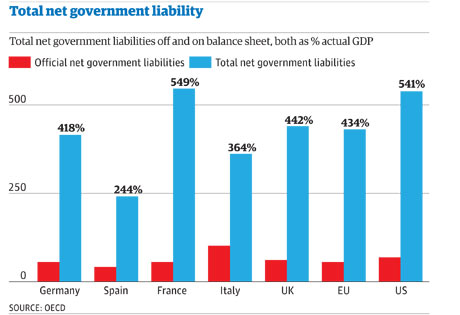
But real debts in the Euro zone are much higher if one used GAAP and added in unfunded liabilities.
Euro banks are part of the problem:
“The Peterson Institute of International Economics has calculated that the 90 banks covered in the latest stress test by the European Banking Authority, need to roll over EUR4.7 trillion in debt over the next 24 months. That is 38% of European Union GDP!.”
The Zeuro zone will print Euro 5 Trillion to bail out its banks. This is 1/3 of its economic size. The distortions from this policy will affect the Euro currency, inflation, trade flows and real incomes. You can only print money for so long before real-world inflation takes hold, and people along with investors begin to view the coloured strips of government IOU's as a worthless promise with little value.
The US is just as bankrupted as the Zeuro zone. There will never be a return to small government in the US. Its days as the world's only superpower are numbered as its political, media and governmental elite chase down the EU-topian dream of unfettered governance, endless taxation, incredible power, and the institutionalizing of politics as a corrupt family business, to be handed down from Dad and Mom to various progeny.
John Maudlin: “The US cannot pay an estimated $200 trillion (and growing) in entitlement obligations (Burns and Kotlikoff, The Clash of Generations), although others say that we owe a “mere” $80-plus trillion. Japan cannot continue to borrow 45% of its government budget at 1% when debt is at 230 % of GDP and rising over 10% a year. Europe cannot postpone the consequences of an unequal currency union forever.”
The modern welfare-capitalist state [Robert Gilpin] is long dead and bankrupted. Every single modern state is insolvent. Socialism has a tendency to destroy. Utopian systems usually end in destruction if not in large amounts of bloodshed.
Real US debt levels using GAAP, at 2010 levels are at least $76 trillion, [maybe Maudlin's 200 Trillion is more accurate, who knows]:
|
U.S. Government - Alternative Fiscal Deficit and Debt |
||||||
|
Sources: U.S. Treasury, Shadow Government Statistics. |
||||||
|
Fiscal |
Formal |
GAAP |
GAAP |
GAAP |
Gross |
Total(2) |
|
Alternative |
|
|
|
|
|
|
|
2010 |
$1,294.1 |
$2,080.3 |
$5.3(3) |
$68.9(3) |
$13.6 |
$76.3(3) |
|
|
|
|
|
|
|
|
|
Official |
|
|
|
|
|
|
|
2010 |
$1,294.1 |
$2,080.3 |
($7.0) (3) |
$56.5(3) |
$13.6 |
$64.0(3) |
|
|
|
|
|
|
|
|
|
2009(4) |
1,417.1 |
1,253.7 |
4.3 |
63.6 |
11.9 |
70.5 |
|
2008 |
454.8 |
1,009.1 |
5.1 |
59.3 |
10.0 |
65.6 |
|
2007 |
162.8 |
275.5 |
1.2(5) |
54.3 |
9.0 |
59.8 |
|
2006 |
248.2 |
449.5 |
4.6 |
53.1 |
8.5 |
58.2 |
|
2005 |
318.5 |
760.2 |
3.5 |
48.5 |
7.9 |
53.3 |
|
2004 |
412.3 |
615.6 |
11.0(6) |
45.0 |
7.4 |
49.5 |
|
2003 |
374.8 |
667.6 |
3.0 |
34.0 |
6.8 |
39.1 |
|
2002 |
157.8 |
364.5 |
1.5 |
31.0 |
6.2 |
35.4 |
|
*SS = Social Security |
||||||
The US likely has at least $100 Trillion in real debt levels in 2013. This number is so huge it does not matter if it is $76 Trillion or $100 Trillion or $200 Trillion. It is 5-10 times the size of the US economy, and no society in history has survived a real debt level of more than 2 times. When a stack of $1 bills representing the real debt can stretch to the moon or 238.000 miles; the game is over, notwithstanding political and media rhetoric.